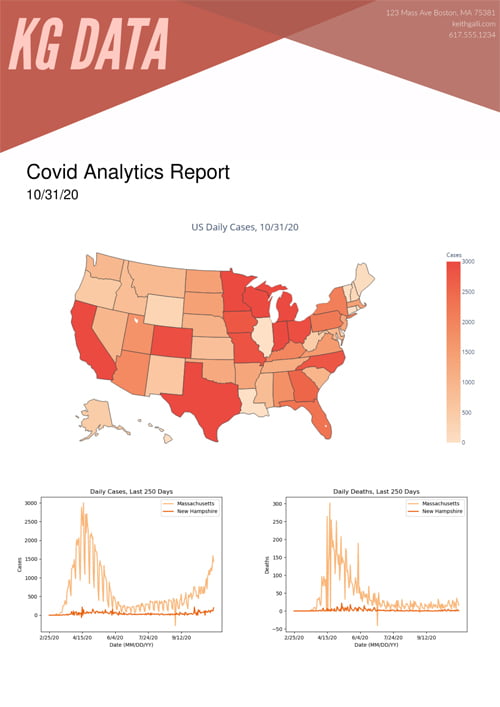
Python 3 FPDF script to generate COVID-19 analytics report with Charts & Maps using pandas and plotly library.
Generate COVID-19 Analytics Report

In this article, we will use a GitHub repository to generate a COVID-19 analytics report. This repo goes along with a YouTube video “Generating an Analytics Report (PDF) in Python”. In it, we learn how to use the fpdf library to create a report like the one you see above.
Link to video: https://youtu.be/UmN2_R4KEg8
Setup
You’ll want to download all of this source code locally. The easiest way to do that is by cloning the repo.
git clone https://github.com/KeithGalli/generate-analytics-report.git
If you have any trouble doing this, you can download the .zip file of this repo and then extract the files to a local folder. Once you have all the files cloned locally, you should make sure you have all the necessary libraries installed.
pip install fpdf
pip install pandas numpy matplotlib
pip install plotly
pip install -U kaleido
If you run into an error with NumPy, changing the version to 1.19.3 fixed the issue for me.
pip install numpy==1.19.3
To test if everything is set up properly, try running python generate_report.py. You should get a fresh report file. You’ll have to change helper.py to read from the online version of the data if you want to access the previous day (uncomment the BASE_PATH URL and comment BASE_PATH=’./data’). You will also have to comment out the hard-coded date at the bottom of the generate_report.py file. I saved it this way so that not too many unnecessary requests to the GitHub server were made while testing.
